

1. Introduction
In the previous tutorial, we studied 5 key principles of animal development:
- All somatic cells are genomically equivalent.
- Differential gene expression explains the differences between cells.
- Determination precedes differentiation.
- Initial determination and differentiation are caused by cytoplasmic heterogeneity in the egg.
- Induction also causes determination and induction.
In what follows, we’ll learn four additional principles. Let’s go.
2. Principle # 6: Gradients of Morphogens Provide Positional Information that Guide Morphogenesis
As morphogenetic molecules diffuse away from an inducing cell or tissue, they decrease in concentration. Cells that have receptors for a specific morphogen will respond in a way that reflects the strength of the signal. This becomes an important mechanism in determining the form of subsequent growth and development.
An important model organism for demonstrating this has been the tiny roundworm, Caenorhabditis elegans, or C. elegans.
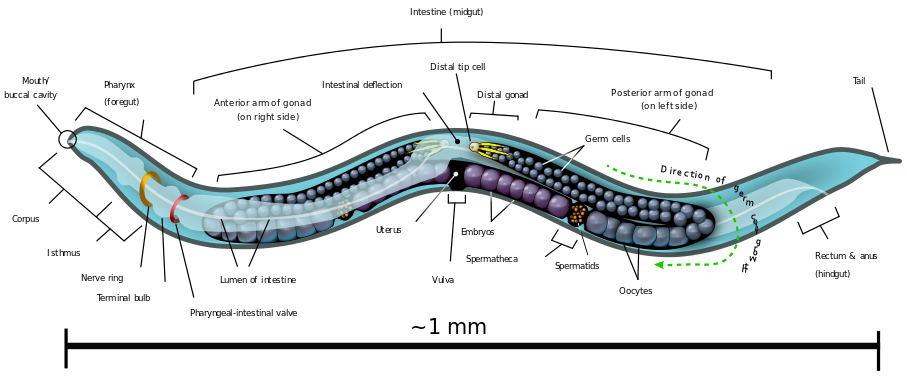
This worm is about a millimeter long and consists of precisely 959 somatic cells (source: Wikipedia)
 If you look directly above the 1mm mark, you’ll see a label that points to the vulva.
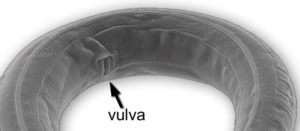
C. elegans is hermaphroditic, and the vulva (shown again at right) is a pore through which the worm lays its eggs. The vulva consists of 22 cells that form from six precursor cells on the worm’s ventral surface (the ventral surface would correspond to our chest and belly, as opposed to our back). Here’s how.
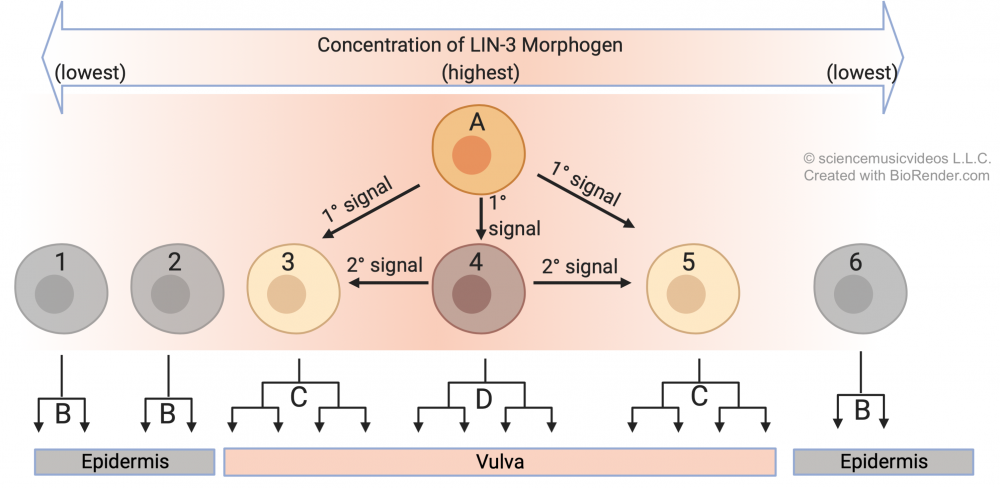
A cell called an anchor cell (“A”) secretes an inducer called LIN-3. The three precursor cells closest to the anchor cell receive the highest dose of LIN-3, but the amount each receives varies as a function of the distance from the anchor cell. Cell 4 receives the highest dose, and that determines the future of that cell and its lineage. Find the upside-down tree at “D”: those are the cells that descend from cell 4, and they’ll be the innermost cells of the vulva. In addition, exposure to this level of LIN-3 induces cell 4 to secrete its own inducing molecule. As a result, cells “3” and “4” receive a dose of LIN-3 and a dose of the secondary inducer. This causes these cells to develop into the outer cells of the vulva. You can see the lineage of cells 3 and 5 in the two trees which are labeled “C” (because they both develop into the same type of cell). Finally, cells 1, 2, and 6 receive no actionable dose of either inducer. As a result, their descendants develop into normal skin cells (shown by the lineages that are labeled “B”).
We can extend this to explain something that many people have never thought about: why our arms (unless we’ve suffered an accident or experienced a problem during development), are very nearly the same length. How did that occur? How did the cells and tissues on the right and left sides of your body grow to be such perfect mirror images of one another?
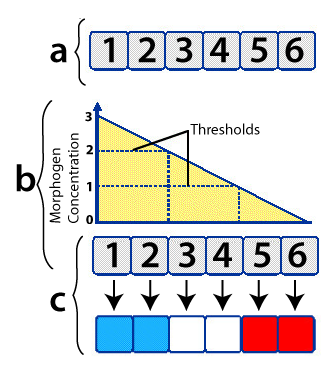
Developmental biologist Lewis Wolpert created a “French Flag Model” to explain how this comes about. Imagine six undifferentiated cells, as shown at “a” on the right, above.
The cells are exposed to different concentrations of the same morphogen (indicated by the graph at “b”). If the cell is exposed to a morphogen concentration that exceeds 2 (arbitrary units) of the morphogen, it develops into a blue cell (which means that a certain constellation of genes will be activated). If the cells are exposed to between 2 and 1 units, they develop into white cells. And if their exposure level is less than one unit, they develop into red cells.
Look again at the example of vulval development above, and see if you can apply the French Flag model. It can also be applied to explaining why your arms are the same length, or, more specifically, how our hands develop.
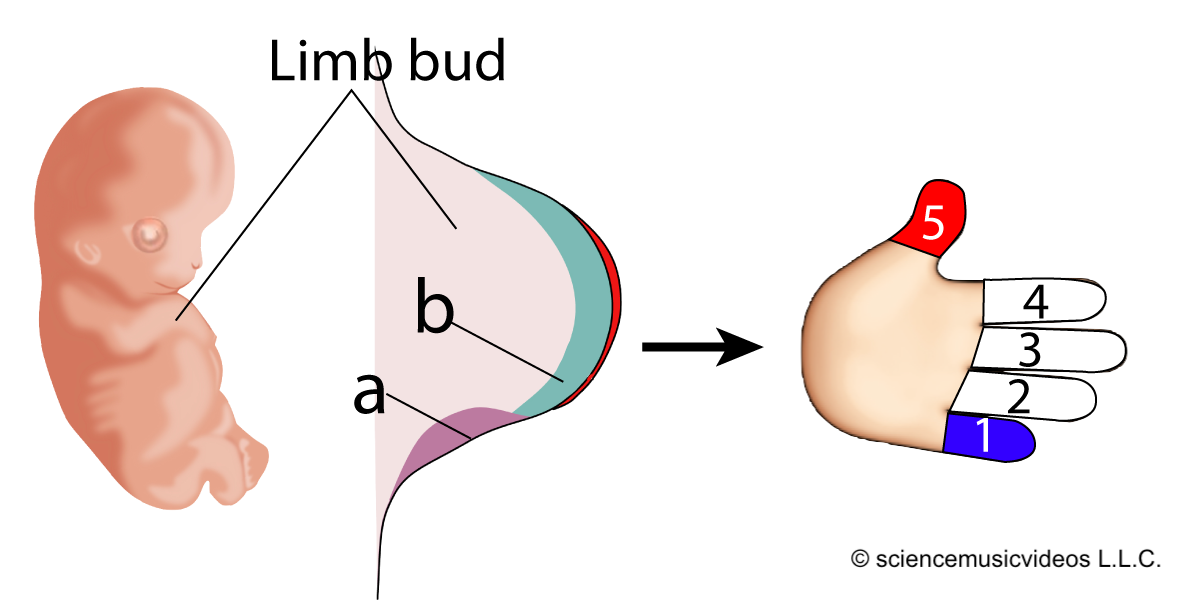
The embryonic limb bud in a vertebrate has a patch of inducing cells called the zone of polarizing activity, or ZPA, shown at “a” in the diagram to the left. The ZPA secretes a morphogen called sonic hedgehog (abbreviated as “Shh,” and indicated by “b”). Shh diffuses from the ZPA, so that the tissue nearest to it receives the highest dose of this morphogen, while the tissue furthest away receives the weakest dose. The result (in humans) is a pinky at position 1, and a thumb at position 5.
See if you can apply the French flag model to the experiment below. Keep in mind that the process that was illustrated above for the human hand applies equally to the development of every vertebrate forelimb. In the case below, you’re applying it to chicken wing development.
[qwiz]
[q]In 1968, John Saunders and Mary Gasseling, working at Marquette University, carried out the following experiment. They transplanted the ZPA from one developing chicken embryo to a second chicken embryo, placing it on the opposite end of the limb bud. Predict the outcome.
[c]U2hvdyB0aG UgQW5zd2Vy[Qq]
[f]VGhlIHJlc3VsdGluZyBsaW1iIGJ1ZCBoYWQgYSBtaXJyb3IgaW1hZ2UgZ3Jvd3RoIHBhdHRlcm4uIFRoZSBzZWNvbmQgWlBBIGluZHVjZWQgYSBzZWNvbmQgcm91bmQgb2YgZGlnaXQgZm9ybWF0aW9uLCBhbmQgdGhlIHJldmVyc2VkIG1vcnBob2dlbiBncmFkaWVudCBleHBsYWlucyB0aGUgcGFydGljdWxhciBsb2NhdGlvbiBvZiBkaWdpdHMu
Cg==[Qq]
[/qwiz]
3. Principle # 7: Induction can lead to apoptosis (programmed cell death), sculpting form as cells are removed
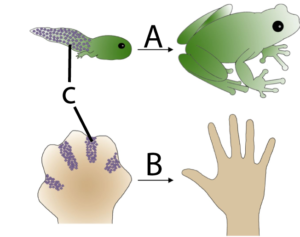
Apoptosis is programmed cell death. It’s a key part of development because it enables an organism to remove unnecessary cells and sculpt its emerging form. In the diagram on the left, you can see how apoptosis (C) in a tadpole’s tail (A) leads to the removal of that structure (something which also happens to human beings during our embryonic development. In B, you can see how at one point during development, our hand is a webbed paddle. Removing cells between the fingers is how distinct digits are formed.
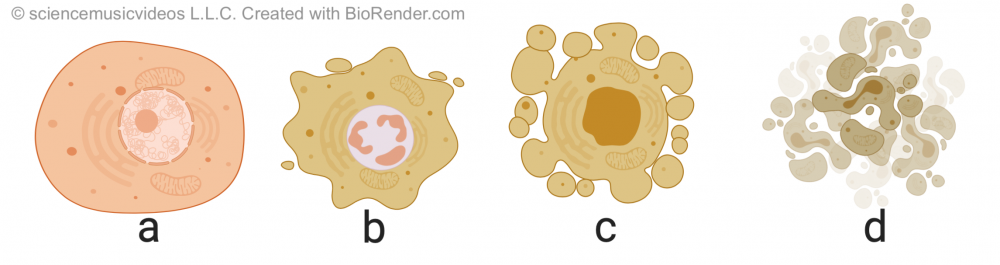 Apoptosis is different from necrosis, which is a form of traumatic cell death that occurs when cells are injured. By contrast, apoptosis is highly regulated and controlled. It starts with cell shrinkage and chromatin condensation (in “b”). This is followed by DNA fragmentation and what’s called “blebbing:” protrusion of the membrane as the membrane uncouples from the cytoskeleton and the internal structure of the cell starts to disintegrate (in “c”). Finally, the cell breaks apart, becoming membrane-bound apoptotic bodies, which are consumed by cells of the immune system
Apoptosis has been extensively studied in C. elegans (the nematode worm discussed above in the context of induction). In the course of the cell divisions that result in this worm’s 959 cells, there are 131 instances of apoptosis. These are initiated by external signals. Here’s how the process works.
 C. elegans has two key apoptosis genes, ced-4 and ced-3. These code for two apoptosis proteins, Ced-4 and Ced-3. “Ced” stands for cell death. In cell “1,” these two proteins (at “d”) are inactive. They’re inactive because of a regulatory protein called Ced-9 (indicated by the glowing star at “b”). Ced-9 is bound to the mitochondrial membrane (“a”), and its effect on Ced-4 and Ced-3 is inhibitory (indicated by the red line with the bar).
If during development, a death signal (“g”) binds with the death signal receptor (at “c”), then a signal transduction cascade (f) alters the structure of Ced-9 so that it no longer inhibits Ced-4 and Ced-3. These proteins, in turn, become activated. This results in further signaling that activates nucleases and proteases (indicated by “i”), resulting in apoptosis. Letter “e” in diagram 2 shows the initiation of the blebbing that characterizes apoptosis.
What’s shown above is called the extrinsic apoptotic pathway, because it’s initiated by a signal from outside the cell. The intrinsic apoptotic pathway is generated from within the cell and can be initiated when a cell has suffered irreparable damage to its DNA, or when excessive protein misfolding has occurred.
4. Checking Understanding: Morphogenetic Gradients and Apoptosis
[qwiz random = “true” style=”width: 600px !important;” qrecord_id=”sciencemusicvideosMeister1961-M25_morphogenetic gradients and apoptosis”]
[h]Quiz: Morphogenetic Gradients and Apoptosis
[i]
[q] In the diagram below, which cell is the primary inducer?
[textentry single_char=”true”]
[c]IG E=
[f]IE5pY2Ugam9iLiBDZWxsICYjODIyMDtBJiM4MjIxOyBpcyB0aGUgcHJpbWFyeSBpbmR1Y2VyIGluIHRoZSBzeXN0ZW0gYWJvdmUu[Qq]
[c]IEVudGVyIHdvcmQ=[Qq]
[c]ICo=[Qq]
[f]IE5vLiBUaGUgcHJpbWFyeSBpbmR1Y2VyIGlzIHRoZSBjZWxsIHRoYXQmIzgyMTc7cyBwdXR0aW5nIG91dCBzaWduYWxzIHRoYXQgZGlyZWN0IHRoZSBkZXZlbG9wbWVudCBvZiB0aGUgb3RoZXIgY2VsbHMu[Qq]
[q] In the diagram below, which letter refers to a lineage of cells that resulted from receiving the highest dose of the morphogen released by cell “A?”
[textentry single_char=”true”]
[c]IE Q=[Qq]
[f]IE5pY2Ugam9iLiBUaGUgbGluZWFnZSBvZiBjZWxscyBzaG93biBhdCAmIzgyMjA7RCYjODIyMTsgYXJlIGRlc2NlbmRlZCBmcm9tIHRoZSBjZWxsIHRoYXQgcmVjZWl2ZWQgdGhlIGhpZ2hlc3QgZG9zZSBvZiBtb3JwaG9nZW4gZnJvbSB0aGUgYW5jaG9yIGNlbGwu[Qq]
[c]IEVudGVyIHdvcmQ=[Qq]
[c]ICo=[Qq]
[f]IE5vLiBIZXJlJiM4MjE3O3MgYSBoaW50OiB0aGUgZG9zZSBvZiBtb3JwaG9nZW4gaXMgcmVwcmVzZW50ZWQgYnkgdGhlIGdyZWVuIHRvIHllbGxvdyBncmFkaWVudC4gRmluZCB0aGUgY2VsbCB0aGF0IHJlY2VpdmVkIHRoZSBoaWdoZXN0IGRvc2UsIGFuZCB0aGVuIGZpbmQgdGhlIGNlbGxzIHRoYXQgZGVzY2VuZGVkIGZyb20gdGhhdCBjZWxsLg==[Qq]
[q] In the diagram below, one cell received a dose of morphogen from the anchor cell, and then became an inducer itself. Which one?
[textentry single_char=”true”]
[c]ID Q=[Qq]
[f]IEV4Y2VsbGVudC4gQ2VsbCAmIzgyMjA7NCYjODIyMTsgcmVjZWl2ZWQgdGhlIGhpZ2hlc3QgZG9zZSBvZiBtb3JwaG9nZW4gZnJvbSB0aGUgYW5jaG9yIGNlbGwuIFRoaXMgY2F1c2VzIGl0IHRvIGJvdGggZGlmZmVyZW50aWF0ZSwgYW5kIGJlY29tZSBhbiBpbmR1Y2VyIGluIGl0cyBvd24gcmlnaHQsIHB1dHRpbmcgb3V0IHNlY29uZGFyeSBzaWduYWxzLg==[Qq]
[c]IEVudGVyIHdvcmQ=[Qq]
[c]ICo=[Qq]
[f]IE5vLiBMb29rIGZvciBhIGNlbGwgdGhhdCBpcyBib3RoIHJlY2VpdmluZyBzaWduYWxzIA==YW5kIHB1dHRpbmcgb3V0IGl0cyBvd24gc2lnbmFscy4=[Qq]
[q] In the diagram below, which lineage of cells received no morphogen from the anchor cells, and as a result didn’t differentiate into a vulval cell?
[textentry single_char=”true”]
[c]IE I=[Qq]
[f]IE5pY2Ugam9iLiBUaGUgY2VsbHMgYXQgJiM4MjIwO0ImIzgyMjE7IHJlY2VpdmUgbm8gbW9ycGhvZ2VuZXRpYyBzaWduYWwgZnJvbSAmIzgyMjA7QS4mIzgyMjE7IEFzIGEgcmVzdWx0LCB0aGV5IGRldmVsb3AgaW50byBlcGlkZXJtYWwgKHNraW4gY2VsbHMpLCBhcyBvcHBvc2VkIHRvIGRpZmZlcmVudGlhdGluZyBpbnRvIHRoZSBzcGVjaWFsaXplZCBjZWxscyBvZiB0aGUgdnVsdmEu[Qq]
[c]IEVudGVyIHdvcmQ=[Qq]
[c]ICo=[Qq]
[f]IE5vLiBIZXJlJiM4MjE3O3MgYSBoaW50LiBUaGUgZ3JhZGllbnQgb2YgbW9ycGhvZ2VuZXRpYyBzaWduYWwgZnJvbSB0aGUgYW5jaG9yIGNlbGwgaXMgc2hvd24gaW4gZ3JlZW4gYW5kIHllbGxvdy4gV2hpY2ggbGluZWFnZSBvZiBjZWxscyByZXN1bHRzIGZyb20gY2VsbHMgdGhhdCBhcmUgb3V0c2lkZSBvZiB0aGF0IHpvbmU/[Qq]
[q] In the diagram below, numbers 1 – 6 represent the spatial position of a group of cells. Which cell would receive the lowest level of morphogenetic signal?
[textentry single_char=”true”]
[c]ID Y=[Qq]
[f]IENvcnJlY3QuIFRoZSBjZWxscyBhdCAmIzgyMjA7NiYjODIyMTsgd291bGQgcmVjZWl2ZSB0aGUgbG93ZXN0IGxldmVsIG9mIGEgbW9ycGhvZ2VuZXRpYyBzaWduYWwu[Qq]
[c]IEVudGVyIHdvcmQ=[Qq]
[c]ICo=[Qq]
[f]IE5vLiBDYXJlZnVsbHkgbG9vayBvdmVyIHRoZSBncmFwaCBvZiBtb3JwaG9nZW4gc2lnbmFsIChhdCAmIzgyMjA7YiYjODIyMTspLiBXaGljaCBjZWxsIGlzIGJlbG93IHRoZSBsb3dlc3QgbGV2ZWwgb24gdGhlIGdyYXBoPw==[Qq]
[q multiple_choice=”true”] Which of the statements below most correctly captures the idea of the following graph.?
[c]R3JhZGllbnRzIG9mIG1vcnBob2dlbnMgZ2l2ZSBjZWxscyBwb3NpdGlvbmFsIGluZm9ybW F0aW9uIHRoYXQgaW5kdWNlcyB0aGVtIHRvIGRldmVsb3AgaW4gYSBjZXJ0YWluIHdheS4=[Qq]
[f]RXhhY3RseSEgVGhhdCYjODIxNztzIHRoZSBpZGVhIGJlaGluZCB0aGlzICYjODIyMDtGcmVuY2ggRmxhZyBNb2RlbC4mIzgyMjE7[Qq]
[c]QmVjYXVzZSBvZiBnZW5ldGljIGRpZmZlcmVuY2VzLCBzb21lIGNlbGxzIHdpbGwgcmVzcG9uZCB0byBtb3JwaG9nZW5zLCBhbmQgb3RoZXJzIHdpbGwgYmUgcmVzaXN0YW50Lg==[Qq]
[f]Tm8uIExvb2sgYXQgdGhlIHJlbGF0aW9uc2hpcCBiZXR3ZWVuIHRoZSBtb3JwaG9nZW4gY29uY2VudHJhdGlvbiwgYW5kIGhvdyBjZWxscyBhcmUgZGV2ZWxvcGluZy4=[Qq]
[c]SW5kdWN0aW9uIGNhbiBjYXVzZSBjZWxscyB0byBiZWNvbWUgZGV0ZXJtaW5lZCBhbmQgZGlmZmVyZW50aWF0ZWQu[Qq]
[f]Tm8sIHdoaWxlIGluZHVjdGlvbiBpcyBhIHBhcnQgb2Ygd2hhdCYjODIxNztzIG9jY3VycmluZyBhYm92ZSwgdGhlcmUmIzgyMTc7cyBtb3JlLiBZb3UgYWxzbyBoYXZlIHRvIHRoaW5rIGFib3V0IHRoZSBtb3JwaG9nZW4gY29uY2VudHJhdGlvbi4=[Qq]
[q] In the diagram below, which digit receives the highest dose of morphogen?
[textentry single_char=”true”]
[c]ID E=[Qq]
[f]IENvcnJlY3QuIFRoZSBwaW5reSBkZXZlbG9wcyB0aGUgd2F5IGl0IGRvZXMgYmVjYXVzZSBvZiBpdHMgZXhwb3N1cmUgdG8gdGhlIGhpZ2hlc3QgY29uY2VudHJhdGlvbiBvZiBtb3JwaG9nZW4gZnJvbSB0aGUgem9uZSBvZiBwb2xhcml6aW5nIGFjdGl2aXR5IChhdCAmIzgyMjA7YS4mIzgyMjE7KQ==[Qq]
[c]IEVudGVyIHdvcmQ=[Qq]
[c]ICo=[Qq]
[f]IE5vLiBIZXJlJiM4MjE3O3MgYSBoaW50LiBUaGUgbW9ycGhvZ2VuIGlzIGJlaW5nIHJlbGVhc2VkIGZyb20gJiM4MjIwO2EuJiM4MjIxOyBUaGUgY29uY2VudHJhdGlvbiBvZiB0aGUgbW9ycGhvZ2VuIHdpbGwgZGVjcmVhc2UgYXMgdGhlIGRpc3RhbmNlIGZyb20gaXRzIHNvdXJjZSBpbmNyZWFzZXMu[Qq]
[q] In the diagram below, which letter or number indicates the zone of polarizing activity?
[textentry single_char=”true”]
[c]IG E=[Qq]
[f]IEV4Y2VsbGVudC4gVGhlIHpvbmUgb2YgcG9sYXJpemluZyBhY3Rpdml0eSBpcyBhdCAmIzgyMjA7YSYjODIyMTs=[Qq]
[c]IEVudGVyIHdvcmQ=[Qq]
[c]ICo=[Qq]
[f]IE5vLiBIZXJlJiM4MjE3O3MgYSBoaW50LiBUaGUgem9uZSBvZiBwb2xhcml6aW5nIGFjdGl2aXR5IGlzIGEgYml0IG9mIHRpc3N1ZSBvbiB0aGUgbGltYiBidWQgdGhhdCByZWxlYXNlcyBhIG1vcnBob2dlbi4=[Qq]
[q] In the diagram below, which number or letter indicates the morphogen gradient?
[textentry single_char=”true”]
[c]IG I=[Qq]
[f]IE5pY2Ugd29yay4gVGhlIG1vcnBob2dlbiBncmFkaWVudCBpcyBhdCAmIzgyMjA7YiYjODIyMTs=[Qq]
[c]IEVudGVyIHdvcmQ=[Qq]
[c]ICo=[Qq]
[f]IE5vLiBIZXJlJiM4MjE3O3MgYSBoaW50LiBUaGUgbW9ycGhvZ2VuIGlzIHJlbGVhc2VkIGZyb20gYSBiaXQgb2YgdGlzc3VlIG9uIHRoZSBsaW1iIGJ1ZCBhbmQgZGVjcmVhc2VzIGluIGNvbmNlbnRyYXRpb24gYXMgaXQgbW92ZXMgYXdheSBmcm9tIGl0cyBzb3VyY2Uu[Qq]
[q]The diagram below is about [hangman] of morphogens, which provide developing tissues with [hangman] information.
[c]Z3JhZGllbnRz[Qq]
[c]cG9zaXRpb25hbA==[Qq]
[q]If a developing cell could talk, you might hear it ask “[hangman] kind of cell should I become?” The answer that that question often involves another question: “[hangman] am I?” As shown below, that answer is often provided by positional [hangman] of [hangman].
[c]d2hhdA==[Qq]
[c]d2hlcmU=[Qq]
[c]Z3JhZGllbnRz[Qq]
[c]bW9ycGhvZ2Vucw==[Qq]
[q]The image below is showing the importance of [hangman] in development.
[c]YXBvcHRvc2lz[Qq]
[q] In the diagram below, blebbing is shown at
[textentry single_char=”true”]
[c]IG M=[Qq]
[f]IE5pY2Ugd29yay4gQXMgdGhlIGNlbGwmIzgyMTc7cyBjeXRvc2tlbGV0b24gZGlzaW50ZWdyYXRlcywgbWVtYnJhbmUgcHJvdHJ1c2lvbnMgY2FsbGVkICYjODIyMDtibGVicyYjODIyMTsgZm9ybS4=[Qq]
[c]IEVudGVyIHdvcmQ=[Qq]
[c]ICo=[Qq]
[f]IE5vLiBIZXJlJiM4MjE3O3MgYSBoaW50LiAmIzgyMjA7QmxlYnMmIzgyMjE7IGFyZSBwcm90cnVzaW9ucyBvZiB0aGUgbWVtYnJhbmUgZm9ybWVkIGFzIHRoZSBjeXRvc2tlbGV0b24gZGlzaW50ZWdyYXRlcy4=[Qq]
[q]The cell below is undergoing [hangman]
[c]YXBvcHRvc2lz[Qq]
[q] In the diagram below, a death signal is shown at
[textentry single_char=”true”]
[c]IG c=[Qq]
[f]IE5pY2Ugd29yay4gTGV0dGVyICYjODIyMDtnJiM4MjIxOyBpcyB0aGUgZGVhdGggc2lnbmFsIHRoYXQgaW5kdWNlcyBhcG9wdG9zaXMu[Qq]
[c]IEVudGVyIHdvcmQ=[Qq]
[c]ICo=[Qq]
[f]IE5vLiBGaW5kIHdoYXQgbG9va3MgbGlrZSBhIHNpZ25hbCB0aGF0IHdvdWxkIGluZHVjZSBhcG9wdG9zaXMu[Qq]
[q] In the diagram below, a death signal receptor is shown at
[textentry single_char=”true”]
[c]IG M=[Qq]
[f]IE5pY2Ugd29yay4gTGV0dGVyICYjODIyMDtjJiM4MjIxOyBpcyB0aGUgZGVhdGggc2lnbmFsIHJlY2VwdG9yLg==[Qq]
[c]IEVudGVyIHdvcmQ=[Qq]
[c]ICo=[Qq]
[f]IE5vLiBGaW5kIHNvbWV0aGluZyBpbiB0aGUgbWVtYnJhbmUgdGhhdCBjb3VsZCByZWNlaXZlIGEgc2lnbmFsIHRoYXQgd291bGQgaW5kdWNlIGFwb3B0b3Npcy4=[Qq]
[q] In the diagram below, the Ced-9 protein is at
[textentry single_char=”true”]
[c]IG I=[Qq]
[f]IE5pY2Ugd29yay4gTGV0dGVyICYjODIyMDtiJiM4MjIxOyBpcyB0aGUgQ2VkLTkgcHJvdGVpbi4=[Qq]
[c]IEVudGVyIHdvcmQ=[Qq]
[c]ICo=[Qq]
[f]IE5vLiBUaGUgQ2VkLTkgcHJvdGVpbiBpcyBhdHRhY2hlZCB0byB0aGUgbWl0b2Nob25kcmlvbi4=[Qq]
[q multiple_choice=”true”] In the diagram below, which statement best reflects the role of the Ced-9 protein.
[c]IFRoZSBDZWQtOSBwcm90ZWluIHNlbmRzIHNpZ25hbHMgdG8gQ2VkLTQgYW5kIENlZC0zIHRlbGxpbmcgdGhlbSB0byBpbml0aWF0ZSBhcG9wdG9zaXMu[Qq]
[f]IE5vLiBOb3RpY2UgaW4gZGlhZ3JhbSAxIHRoYXQgQ2VkLTkgaXMgc2lnbmFsaW5nIENlZC00IGFuZCBDZWQtMywgYnV0IHRoYXQgdGhleSYjODIxNztyZSA=Tk9UIGluaXRpYXRpbmcgYXBvcHRvc2lzLg==[Qq]
[c]IFRoZSBDZWQtOSBwcm90ZWluIHNlbmRzIGluaGliaXRvcnkgc2lnbmFscyB0byBDZWQt NCBhbmQgQ2VkLTMsIHByZXZlbnRpbmcgYXBvcHRvc2lzIGZyb20gb2NjdXJyaW5nLg==[Qq]
[f]IFRoYXQmIzgyMTc7cyBjb3JyZWN0LiBBcyB5b3UgY2FuIHNlZSBpbiBkaWFncmFtIDEsIHRoZSBtZXNzYWdlcyBzZW50IGZyb20gQ2VkLTkgdG8gQ2VkLTQgYW5kIENlZC0zIGFyZSA=aW5oaWJpdG9yeSwgcHJldmVudGluZyBhcG9wdG9zaXMgZnJvbSBvY2N1cnJpbmcu[Qq]
[c]IFRoZSBDZWQtOSBwcm90ZWluIGFzc2lzdHMgdGhlIGVudHJ5IG9mIHB5cnV2aWMgYWNpZCBpbnRvIHRoZSBtaXRvY2hvbmRyaW9uIGR1cmluZyB0aGUgbGluayByZWFjdGlvbi4=[Qq]
[f]IE5vLiBOb3RpY2UgdGhhdCBDZWQtOSBzZWVtcyB0byBiZSBzZW5kaW5nIGEgc2lnbmFsIHRvIENlZC00IGFuZCBDZWQtMywgYnV0IHRoYXQgdGhlc2UgY2VsbCBkZWF0aCBwcm90ZWlucyBhcmUgbm90IGluaXRpYXRpbmcgYXBvcHRvc2lzLg==[Qq]
[/qwiz]
5. Principal # 8: Developmental genes are expressed in a hierarchical sequence, from general to specific
When you look at the life cycle of any complex multicellular organism, it seems obvious that development unfolds in a way where general structures are laid down first, followed by an ever finer articulation of form. How else could it be? In our development, we start life as a zygote. In the blastula phase, we develop into a sphere. Gastrulation creates a three-layered embryo, and then appendages and organs start to emerge.
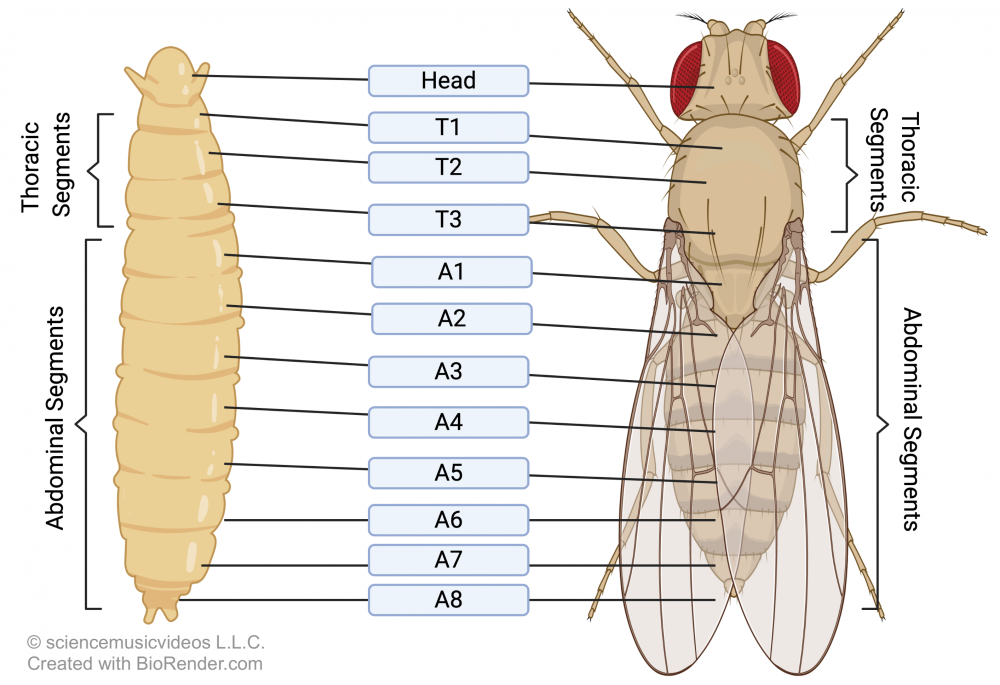 This articulation of form has been extensively studied in the fruit fly Drosophila melanogaster, especially in the context of how a cascade of gene activations results in this animal’s segmented structure. You can see Drosophila’s segmentation in the image at left. This segmentation has fully emerged by the end of Drososphila’s larval stage, with eight abdominal segments, three thoracic segments, and a head. How do these segments develop?
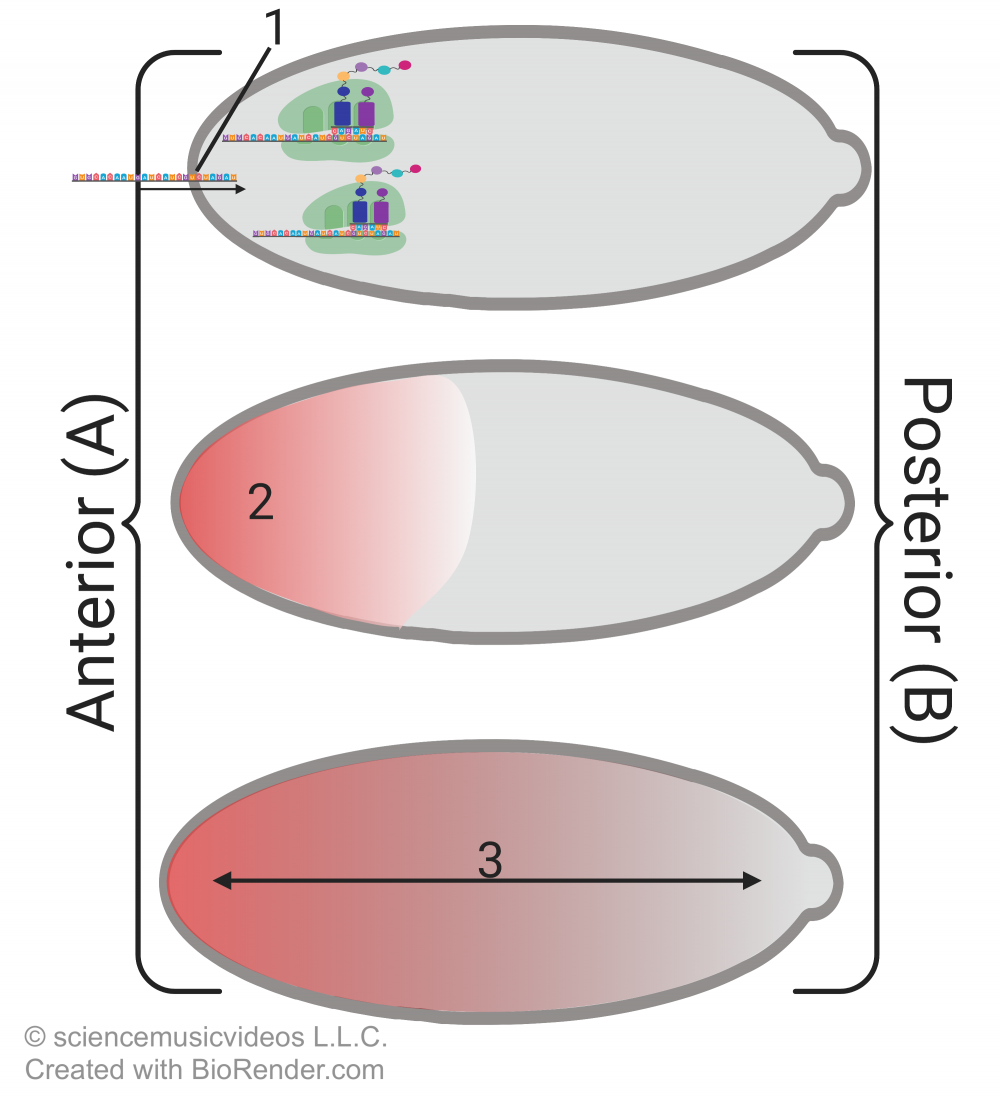 As discussed in the previous tutorial in this module, the process begins with cytoplasmic differences in the egg. Cells that are adjacent to the egg on the anterior (head) side secrete an mRNA called bicoid (“1”) into the egg. The mRNA is translated into the bicoid protein, which accumulates on the anterior (head) of the embryo, creating a morphogenetic gradient (at “3”).
The bicoid protein stimulates the transcription of a second morphogen called hunchback, which is what establishes the head region. A third morphogen called nanos amplifies the difference between the anterior and posterior ends. The egg’s cytoskeleton transports nanos mRNA to the posterior end of the embryo, where it gets translated into the nanos protein. Nanos inhibits translation of the hunchback mRNA, ensuring that there’s no hunchback at the embryo’s posterior. A fourth protein called caudal creates yet another morphogenetic gradient. Because caudal translation is blocked by bicoid, caudal is in high concentration at the embryo’s posterior, and low concentration at the anterior.
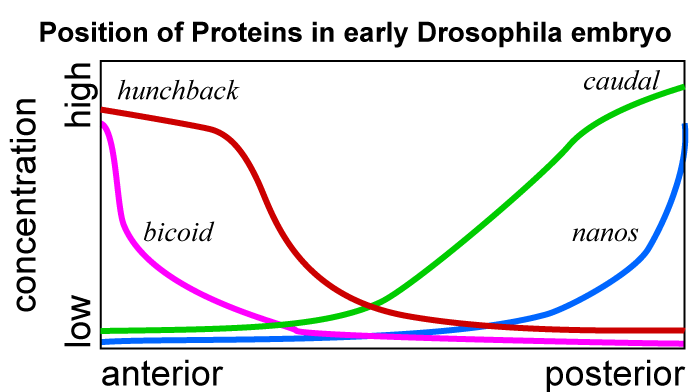
The graph at right shows the relative concentrations of each of these four morphogens. For our purposes, the key point is that the relative concentration gives each cell a clear answer to the question “where am I in the organism?” And the answer to that question influences each cell’s subsequent determination and differentiation.
Once maternal effect genes (bicoid, nanos, etc). have established the anterior-posterior axis has been established, a series of inductions start defining broad regions, then segment locations, then the anterior-posterior orientation of each segment.
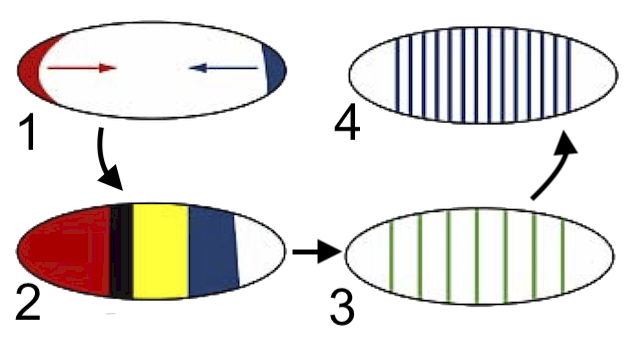
The first genes to be activated are the ones discussed above. These are the maternal effect genes (1), and they create the initial concentration gradients that establish the embryo’s anterior-posterior axis.
Gap genes (2) are activated next, and they define several broad body regions.
After expression of the gap genes, pair-rule genes (3) are turned on. They’re expressed in striped patterns of seven bands.
Finally, segment polarity genes (4) are activated. These determine the boundaries of each segment and their anterior-posterior orientation. At this stage, all of the segments of the drosophila’s body have been defined.
6. Principle # 9: Homeotic Genes regulate the Development of Anatomical Structures
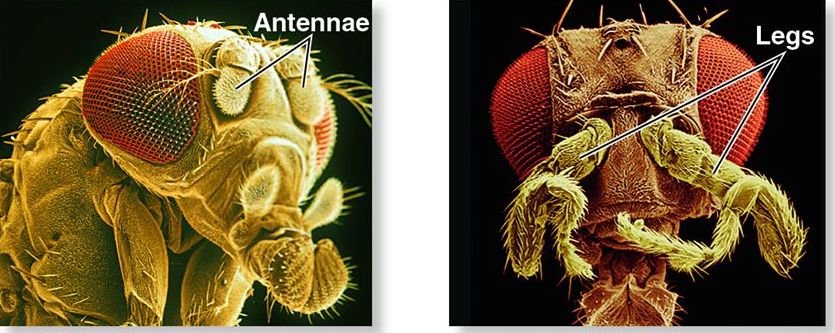
The term homeosis was first coined in 1894 by biologist William Bateson to describe natural variations in which an expected body part on an animal is replaced by another part (Wikipedia). For example, look at the photograph to the left of a fruit fly with a leg growing where there’s supposed to be an antenna. That kind of variation is called a homeotic mutation, and it’s caused by a mutation in a homeotic gene: a gene that controls how structures develop in various parts of the body.
Homeotic genes are widely conserved in evolution: they’re found in chordates, echinoderms (sea stars and urchins), arthropods, and plants.
In any animal with a segmented body plan (which includes humans and all other chordates: think of the structure of our vertebral column or rib cage), the homeotic genes are called hox genes: their function is to specify the identity of each segment by controlling which structures grow on which segment.
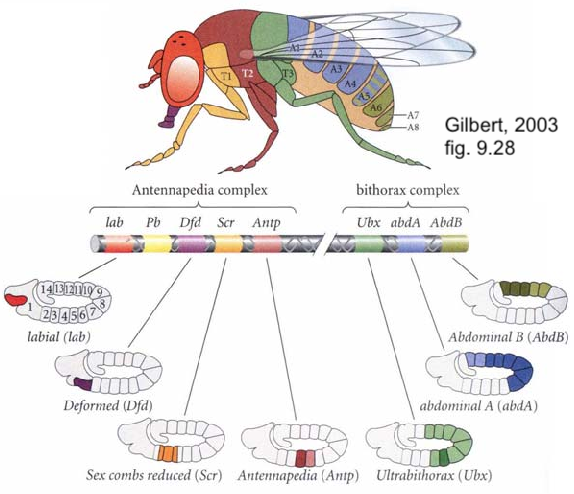 In Drosophila, Hox genes are organized in two clusters on chromosome 3. The first cluster is the Antennapedia cluster (named for one of the genes on this cluster). The antennapedia cluster consists of 5 genes that control the development of structures on the head and the anterior part of the thorax. The second cluster is called the Bithorax cluster (named for one of its three genes, called ultrabithorax). These genes control the development of appendages on the posterior part of the thorax and the abdomen.
Notice, in the diagram on the left, that the Hox genes are arrayed in a way that aligns with the genes’ expression in the body. In other words, the first of the eight homeotic genes (lab) is expressed in the foremost section of the body (the head). The last (AbdB) is expressed in the posterior tip of the abdomen.
As you might expect, Hox genes code for transcription factors. All hox genes share a 180 base-pair sequence in their DNA that’s called a homeobox. 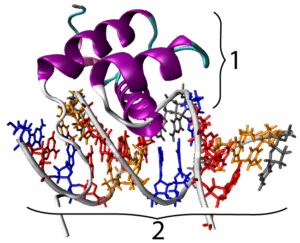 The homeobox codes for a sequence of 60 amino acids that form a homeodomain. The homeodomain is a DNA-binding motif that allows the various transcription factors that these genes code for to bind with the promoter regions of their target genes. In the image at left, you can see a representation of a hox protein, with its homeodomain (at “1”), binding with one of its target genes.
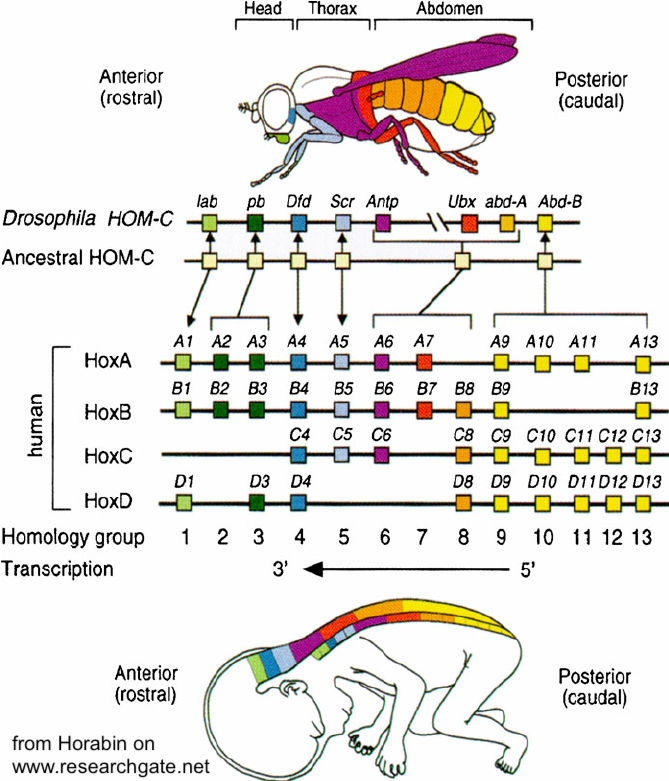
Evolutionarily, homeotic genes have been conserved to an astonishing degree. Despite there being over half a billion years since arthropods and vertebrates shared a common ancestor, homologous Hox gene sequences control development in each of these clades. Not only that but the same co-linear organization has been maintained in both groups of animals. This is a topic that I’ll address in a future tutorial on evolution and development (evo-devo: coming soon).
7. Quiz: Genetic Hierarchies, Homeotic Genes
[qwiz random = “true” qrecord_id=”sciencemusicvideosMeister1961-M25_Genetic Hierarchies (segmentation), Homeotic Genes”]
[h]Quiz: Genetic Hierarchies, Homeotic Genes
[i]Biohaiku
Homeotic Genes
Each appendage in its place
In both flies and us!
[q] Developmental genes are expressed in a hierarchical sequence, from [hangman] to specific.
[c]IGdlbmVyYWw=[Qq]
[f]IEdyZWF0IQ==[Qq]
[q] As can be seen in the diagram below, the development of segmentation in insects like drosophila starts with cells responding to [hangman] differences in the egg.
[c]IGN5dG9wbGFzbWlj[Qq]
[f]IEdyZWF0IQ==[Qq]
[q] The diagram below represents a drosophila egg. Which letter (A or B) indicates where the head will develop?
[textentry single_char=”true”]
[c]IE E=[Qq]
[f]IE5pY2Ugd29yay4gVGhlIGhlYWQgd2lsbCBkZXZlbG9wIGF0ICYjODIyMDtBJiM4MjIxOw==[Qq]
[c]IEVudGVyIHdvcmQ=[Qq]
[c]ICo=[Qq]
[f]IE5vLiBUaGUgaGVhZCB3aWxsIGRldmVsb3Agd2hlcmUgdGhlIGJpY29pZCBtUk5BIGFuZCB0aGUgYmljb2lkIHByb3RlaW4gYXJlIGluIHRoZWlyIGhpZ2hlc3QgY29uY2VudHJhdGlvbi4=[Qq]
[q] The diagram below represents a drosophila egg. Bicoid mRNA is represented by
[textentry single_char=”true”]
[c]ID E=[Qq]
[f]IEV4Y2VsbGVudC4gTnVtYmVyIDEgcmVwcmVzZW50cyBiaWNvaWQgbVJOQS4=[Qq]
[c]IEVudGVyIHdvcmQ=[Qq]
[c]ICo=[Qq]
[f]IE5vLiBMb29rIGZvciBzb21ldGhpbmcgdGhhdCBjb3VsZCByZXByZXNlbnQgYSBzaW5nbGUtc3RyYW5kZWQgbW9sZWN1bGUgKGxpa2UgbVJOQSku[Qq]
[q labels = “top”]The drawings below represent protein expression resulting from gene activation. What’s the correct order in which the corresponding genes would be turned on?
[l]first
[fx] No, that’s not correct. Please try again.
[f*] Great!
[l]second
[fx] No. Please try again.
[f*] Correct!
[l]third
[fx] No, that’s not correct. Please try again.
[f*] Excellent!
[l]fourth
[fx] No. Please try again.
[f*] Good!
[q multiple_choice=”true”]The story behind the diagram below is that
[c]RHVyaW5nIGRldmVsb3BtZW50LCBhcG9wdG9zaXMgY2FuIHNjdWxwdCBmb3JtIGJ5IHJlbW92aW5nIHVubmVjZXNzYXJ5IGNlbGxzLg==[Qq]
[f]Tm8uIFRoYXQgaXMgYSB0cnVlIHN0YXRlbWVudCwgYnV0IGl0JiM4MjE3O3Mgbm90IHRoZSBiZXN0IHN0b3J5IHJlbGF0ZWQgdG8gdGhlIGltYWdlIGFib3ZlLiBIZXJlJiM4MjE3O3MgYSBoaW50OiBjb3VudCB0aGUgbnVtYmVyIG9mIHJlZ2lvbnMgZnJvbSB0b3AgdG8gYm90dG9tLiBpcyB0aGUgc3RydWN0dXJlIGJlY29taW5nIG1vcmUgb3IgbGVzcyBjb21wbGV4Pw==[Qq]
[c]TW9ycGhvZ2VuZXRpYyBncmFkaWVudHMgY2FuIGRldGVybWluZSB0aGUgZGV2ZWxvcG1lbnRhbCBmYXRlIG9mIGNlbGxzLg==[Qq]
[f]Tm8uIFRoYXQmIzgyMTc7cyB0cnVlLCBidXQgaXQmIzgyMTc7cyBub3QgdGhlIGJlc3Qgc3RvcnkgcmVsYXRlZCB0byB0aGUgaW1hZ2UgYWJvdmUuIEhlcmUmIzgyMTc7cyBhIGhpbnQ6IGNvdW50IHRoZSBudW1iZXIgb2YgcmVnaW9ucyBmcm9tIHRvcCB0byBib3R0b20uIGlzIHRoZSBzdHJ1Y3R1cmUgYmVjb21pbmcgbW9yZSBvciBsZXNzIGNvbXBsZXg/[Qq]
[c]RHVyaW5nIGRldmVsb3BtZW50LCBnZW5lcmFsIHBhdHRlcm5zIGFyZSBsYWlkIGRv d24gZmlyc3QsIHRoZW4gbW9yZSBzcGVjaWZpYyBzdHJ1Y3R1cmVzIGZvbGxvdy4=[Qq]
[f]WWVzLiBUaGF0JiM4MjE3O3MgZXhhY3RseSB3aGF0JiM4MjE3O3MgaGFwcGVuaW5nIGluIHRoZSBkaWFncmFtIGFib3ZlLg==[Qq]
[q]The diagram below is related to the development of [hangman] in Drosophila.
[c]c2VnbWVudGF0aW9u[Qq]
[q]As shown below genes that specify which structures grow on which segment or section of the body are called [hangman] genes.
[c]aG9tZW90aWM=[Qq]
[q]Homeotic genes code for [hangman].
[c]dHJhbnNjcmlwdGlvbiBmYWN0b3Jz[Qq]
[q]The [hangman] is a conserved 180 base pair sequence shared by all Hox genes. It codes for a 60 amino acid sequence called a [hangman], shown at “1” below. This protein motif, in turn, can bind with DNA sequences in the [hangman] of the genes that it transcribes.
[c]aG9tZW9ib3g=[Qq]
[c]aG9tZW9kb21haW4=[Qq]
[c]cHJvbW90ZXJz[Qq]
[q]The diagram below shows how homeotic genes have been [hangman] in the lineages of almost all animals.
[c]Y29uc2VydmVk[Qq]
[/qwiz]
Links
This tutorial ends this module on animal development.
- Return to Animal Development Main Menu
- Use the menus above to choose another module